Ranked hotspots
Four districts from the study, each with its own brief: why it ranks, what it is, and the next best measurement. Two sit inside the withheld region and two inside the training regions, labelled, because the distinction changes what the number means.
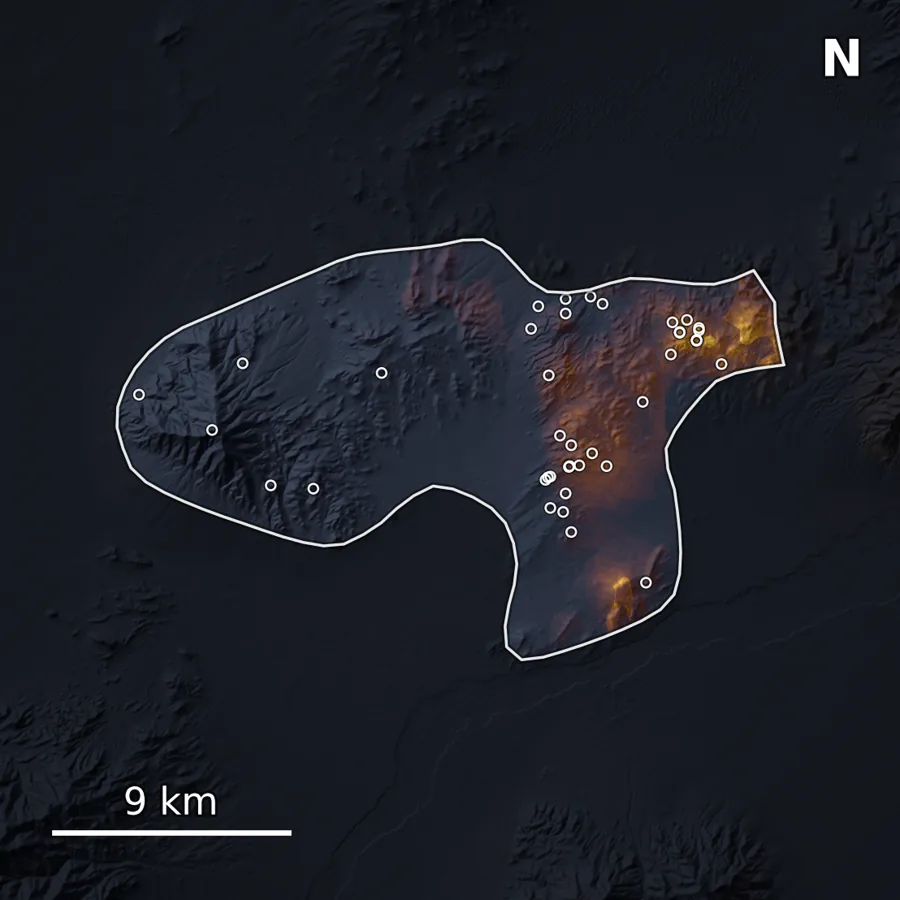
Ten Mile
Humboldt County · Nevada Held-out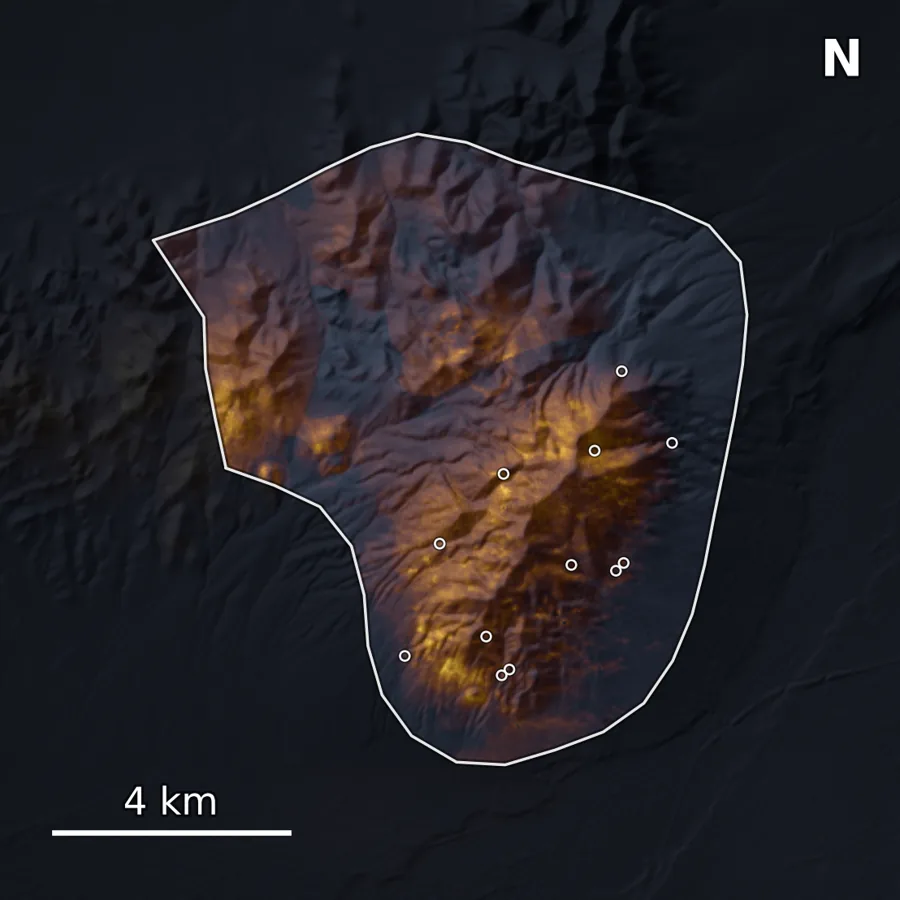
Winnemucca
Humboldt County · Nevada Held-out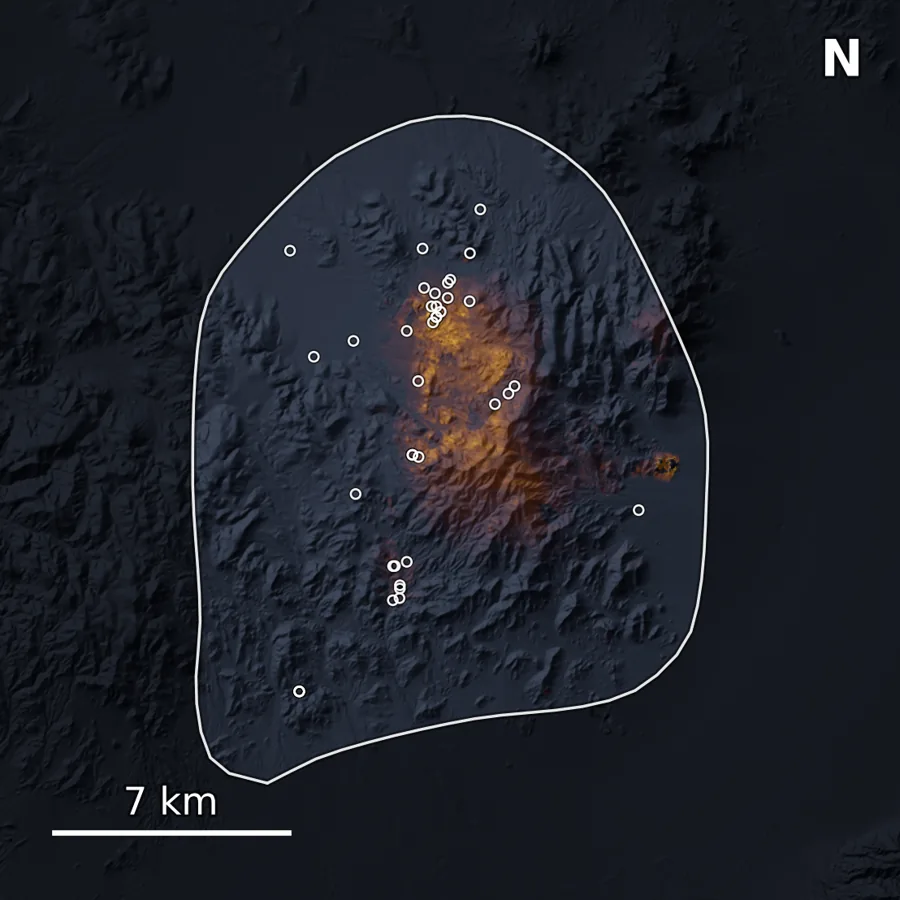
Gilbert
Esmeralda County · Nevada In-sample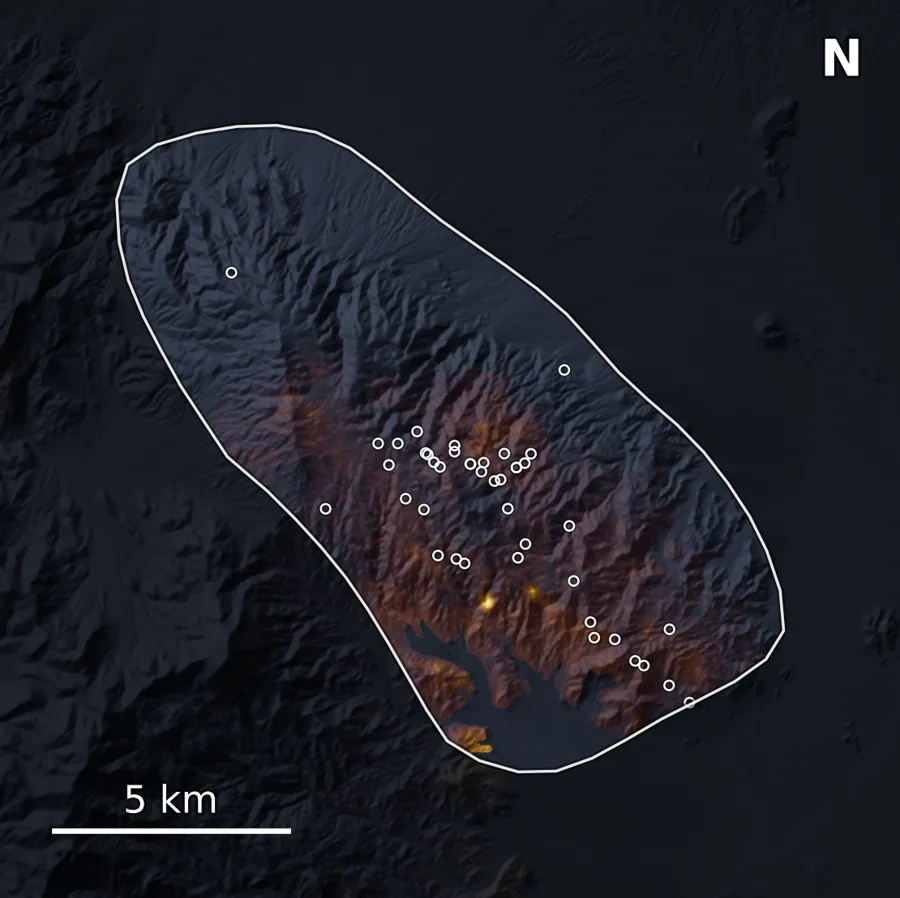
Silver Peak
Esmeralda County · Nevada In-sampleThe scope
Cells scored across roughly 42,000 square miles of Nevada, about 40% of the state. Trained on Southern Walker Lane and the Northern Nevada Rift. Northwestern Nevada withheld from training and scored once.
Miocene epithermal gold-silver. A single deposit class, chosen because its ore and alteration sit at or near the present surface.
Northwestern Nevada was reserved before any modelling began and scored exactly once, at the end.
Executive summary. NOUS Nevada scores every 30-metre cell across three areas of interest for the probability of low-sulfidation epithermal gold. Northwestern Nevada was withheld from the start and scored once, at the end. There the model captures 18.2% of known deposits in the top 5% of ranked ground at ROC-AUC 0.756, within 0.047 of its cross-validated score, the margin that matters, because it measures how much performance survives the move to unseen ground.
The most demanding test is a different one: separating recorded gold from ground somebody visited and recorded as something other than gold. The model separates those at 0.636, and it ranks the deposit class it was built for at 5.5 times the regional median score. Two models were fitted on identical data; the deliverable is the Bayesian one, which returns a calibrated probability with a credible interval and a coefficient per feature that can be argued with.
Objective. The commercial requirement is a ranked, drillable target list with defensible geological reasoning behind each entry. The output is a probability surface with per-cell uncertainty and feature attribution, delivered alongside the district briefs. This sets out the evidence, the test design and the known limitations, so that the ranking can be assessed before it is spent against.
Cross-validation folds were cut along mining-district boundaries rather than at random, so no fold could be trained on part of a geological system and scored on the rest. Only the spatial-split result is reported.
Results
Within a target district, one with epithermal gold at surface, over 80% of known gold falls in the top 5% of ranked ground. Measured on the withheld region.
Across the two training regions, on district-blocked folds. The model ranks the gold site higher in 80% of random pairs.
Northwestern Nevada, scored once. Only 0.04 below the training-region score, the margin a generalising model shows.
Reading these numbers. For targeting, the operative metric is capture efficiency: of the known deposits, what share falls inside the top slice of ranked ground, since that is what a drilling budget consumes. Across the whole withheld region the model captures 18% of deposits in the top 5% of area, 29% in the top 10%, and 47% in the top 20%, against 5%, 10% and 20% by chance.
That is a 3.6-fold concentration at the sharp end. The per-district figure is higher because it is measured inside districts that carry the target system, not across ground where that system is absent.
Baseline comparison. The relevant baseline is what an experienced geologist builds by hand: an anomaly score over the classic pathfinder elements. On the withheld records the strongest single pathfinder, soil antimony, separates deposits at 0.604, and no single input does better. The model reaches 0.756 on those same records.
The margin comes from combining evidence, not from any one layer.
Inside the model
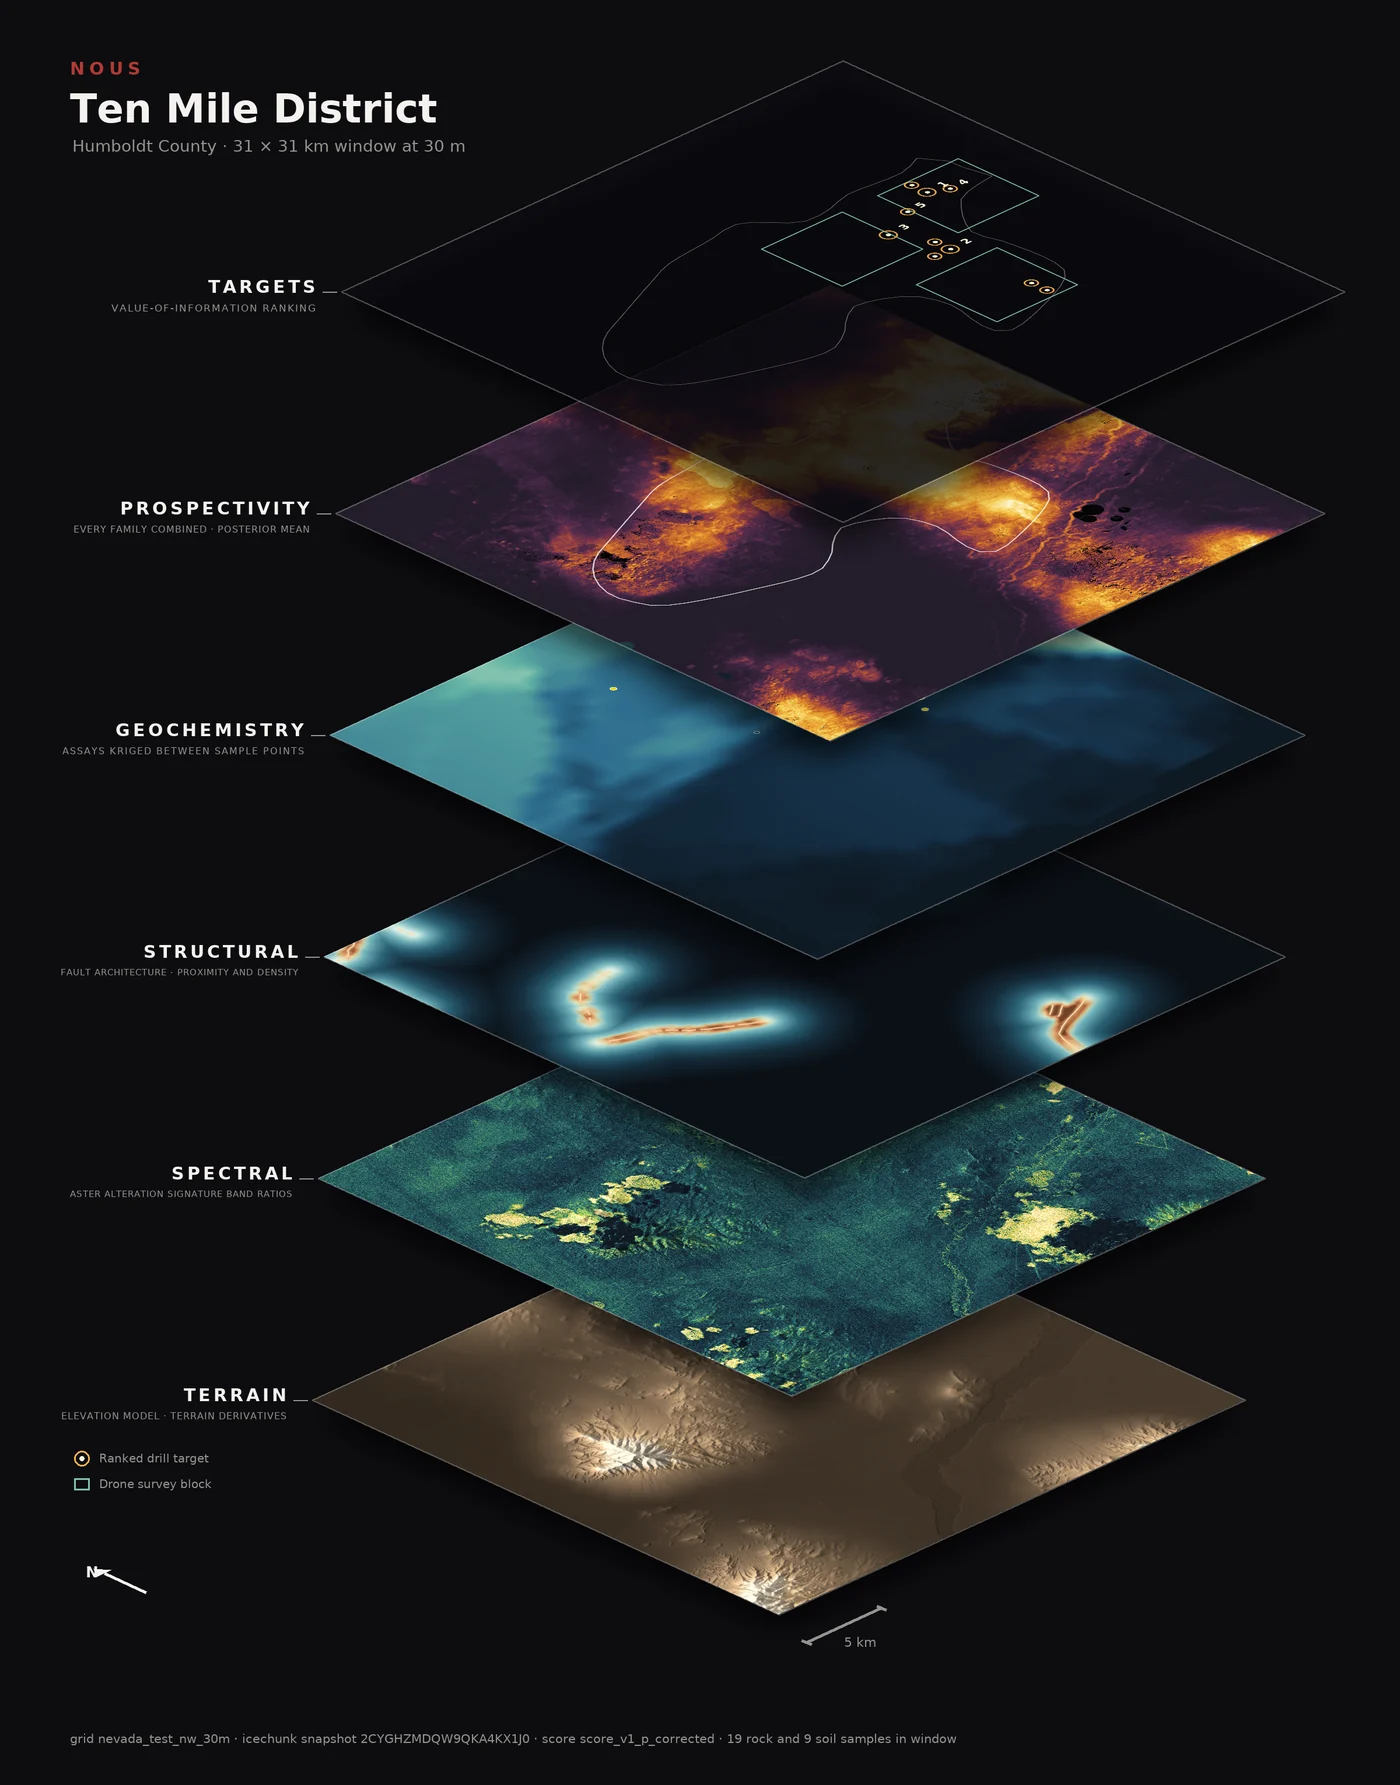
How the ranking is built. Each family of evidence enters as its own layer: an elevation model and its terrain derivatives, satellite band ratios carrying the alteration signature, fault architecture as proximity and density, and assays kriged between sample points.
What comes out. A Bayesian hierarchical model combines the families into one posterior surface, so every cell carries a standard deviation as well as a mean. Uncertainty is a primary output, not a diagnostic afterthought.
What a client receives
-
Ranked drill targets
An ordered list of hotspots priced against a drilling budget, with the geological reasoning behind every entry.
-
Hotspot briefs
Per-target documents covering the evidence supporting the rank and the deposit-class fit. The four above are examples.
-
Next best measurement
For each candidate follow-up, how much uncertainty that measurement would remove. The next step is recommended, not guessed.